Infographics offer a dynamic and visually appealing way to present information, making complex data understandable, engaging, and memorable for a wide range of audiences. Here are some of the favorite ones I’ve made.
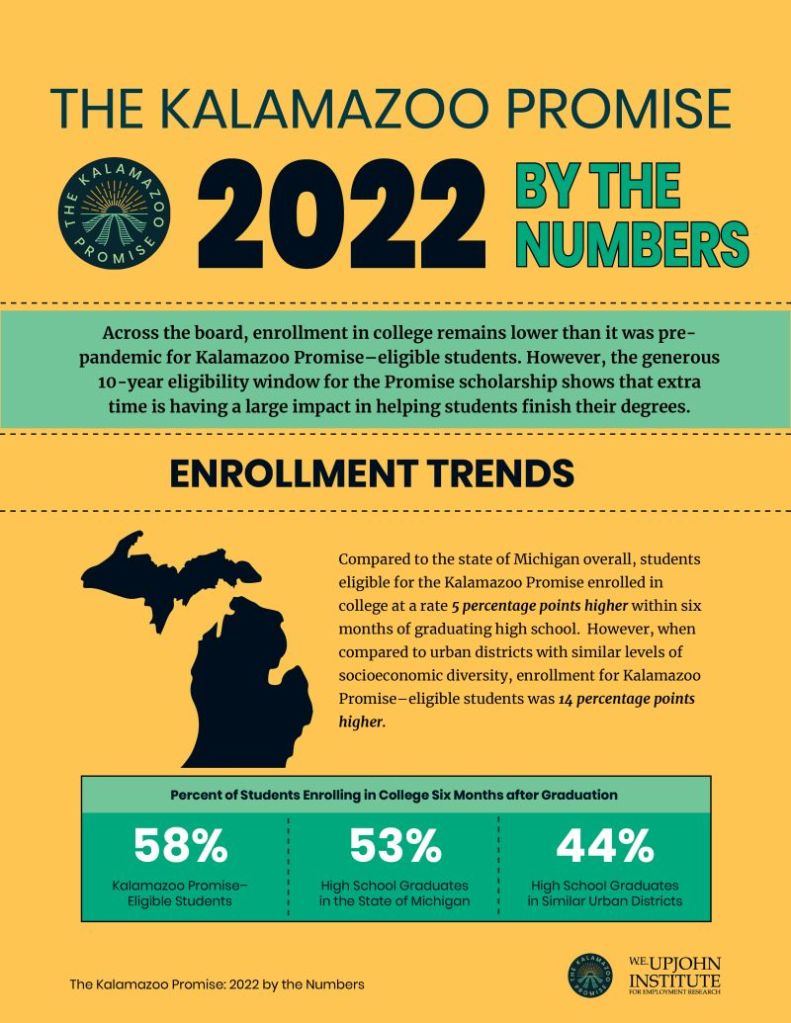
The Kalamazoo Promise: 2022 By the Numbers
I designed this infographic to help provide context for year-over-year trends in the Kalamazoo Promise with an emphasis on equity outcomes for the scholarship program.
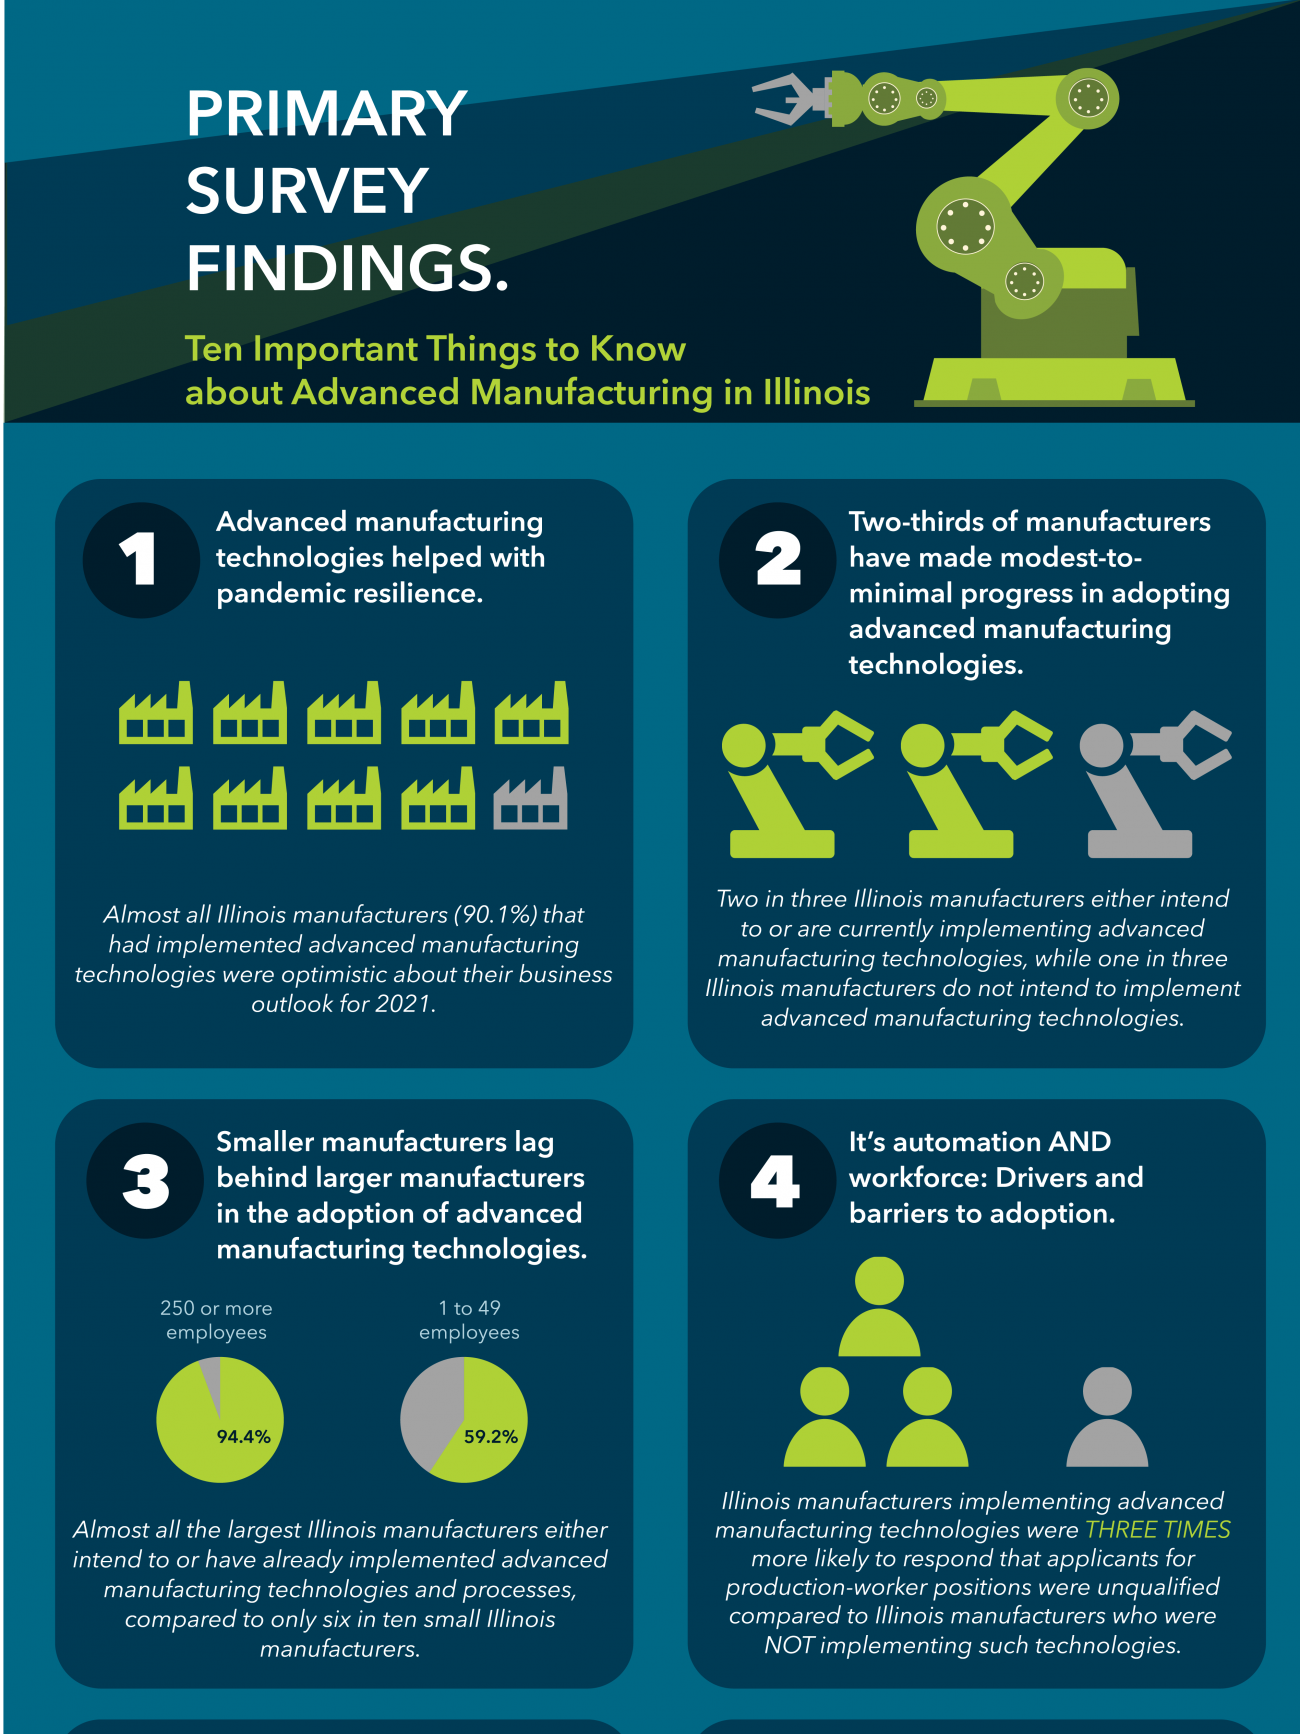
Illinois study identifies 10 important things to know about advanced manufacturing
I designed this infographic to help summarize the key findings from my survey on advanced manufacturing in Illinois. In addition to doing the research for this project, I also designed the report and all the visualizations.
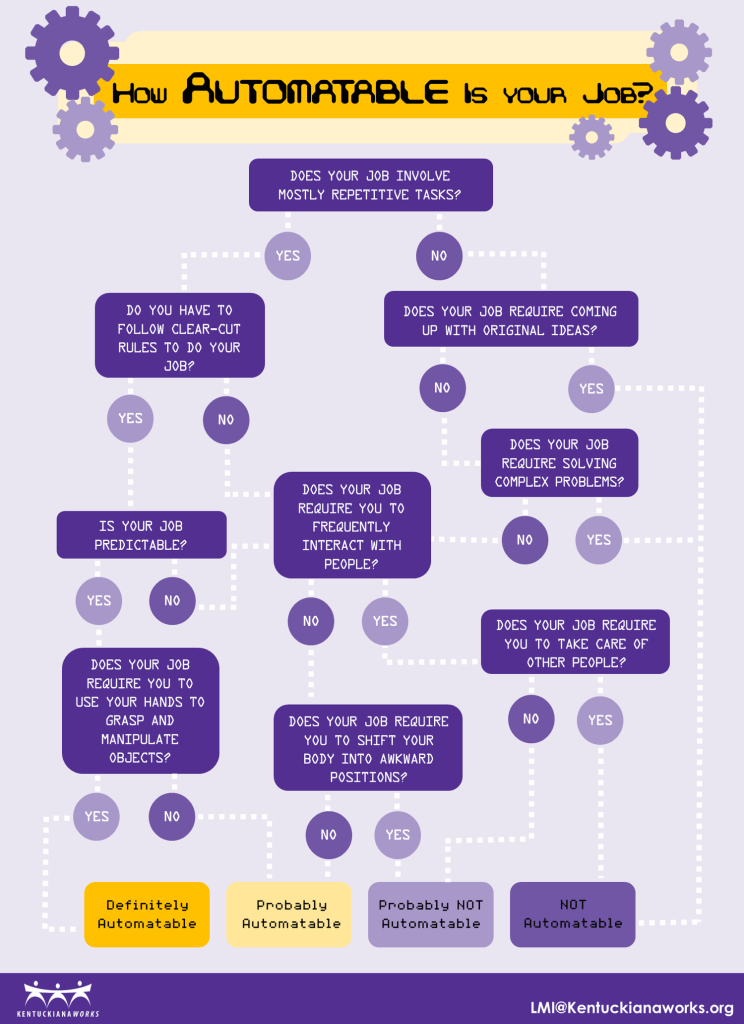
In this flowchart, I summarize the methodology behind Frey and Osbourne’s “Future of Employment” paper to help a general audience better understand what makes a job automatable.